Thursday, October 29, 2015
Now is a really good time to...
Go long UGAZ or short DGAZ. Major percentages will be made on this trade.
Thursday, October 8, 2015

Wednesday, October 7, 2015
Sold all BRZU
Biggest position now is short DGAZ. I don't see many other opportunites except for DGAZ which I think are highly valued here. Natural gas doesn't have much room to go down. But if it does I will add to the position. Liquidity is high.
Wednesday, September 23, 2015
Saturday, August 29, 2015
A study of climbs in inverse leveraged ETFs
I have been toying with the idea of going long reverse leveraged ETFs lately so I put in some hours studying them.
There are a couple different indicators to use for going long. The one I feel most comfortable with is a breakout pattern in combination with higher highs and higher lows. Let's look at the break out pattern first:


Also downtrend, but would have been hard to avoid. A stop loss would have triggered

First one could have been profitable depending on the stop loss level. Second one also but only with a loose stop loss. It would have been easy to loose money on both.


There are a couple different indicators to use for going long. The one I feel most comfortable with is a breakout pattern in combination with higher highs and higher lows. Let's look at the break out pattern first:

So the pattern is some kind of channeled choppiness and a breakout from the top channel. Now the channel doesn't have to be parallel, it could be triangular as well, it is usually upwards sloping but not always. There always has to be a breakout from the top channel.
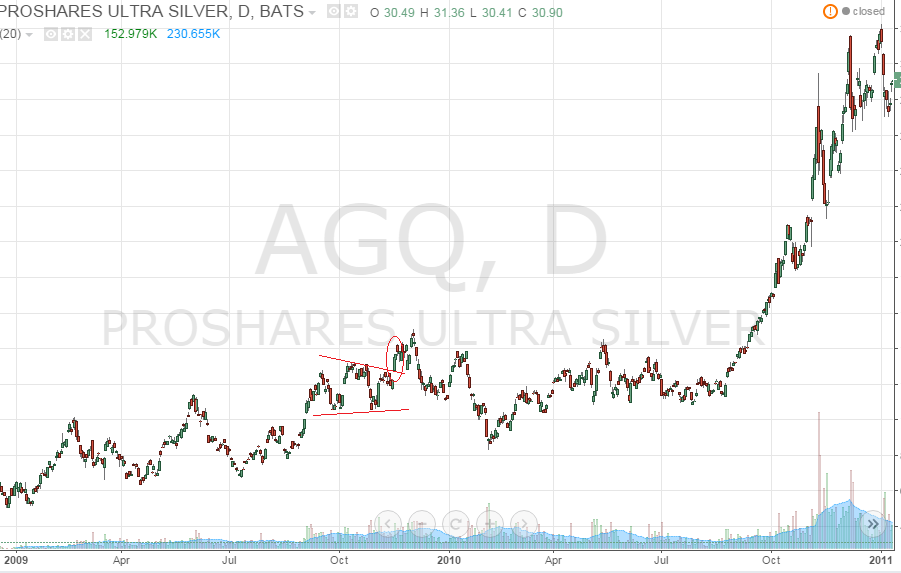
Let's look at some examples. Here are some upwards sloping trend channel breakouts:


But the breakout can also happen from downwards sloping trend channels and also really steep upwards sloping trend channels:


Here is the breakout pattern visible in a non inverse chart:

In order to get a fuller picture let's look at times when the pattern fails:
This is a clean fail. Could have still been profitable with a loose stop loss level.

This one was downsloping in a severe downtrend. Would have needed stop loss in order to avoid major loss.

Also downtrend, but would have been hard to avoid. A stop loss would have triggered

First one could have been profitable depending on the stop loss level. Second one also but only with a loose stop loss. It would have been easy to loose money on both.

A small profit would have been made right away but would have needed to take a partial at the first top for that. In total a stop loss would have triggered. Unprofitable.

Guaranteed stop loss trigger
.

Loose stop loss might have saved this one. Partial profit might have been taken in an early stage. (Unlikely)

Stop loss trigger. Breakout not clean.

Loose stop loss could save it. Breakout is red.

Stop loss trigger. Partial profit possible.

Stop loss trigger. Severe down trend.

This is an attempt to define a good stop loss level. This should not get stop lossed because the pullbacks are above the start of the pattern.

A clear stop loss trigger.
So in conclusion I haven't decided if this pattern is something I want to play yet. I'll probably analyse climbs in non inverse leveraged ETFs a bit further first.
Sunday, August 23, 2015
Oil and trading rules

Since the last update oil went and shocked the world. I think the turn is close now. Unfortunately I got overcommited. the lesson for me is to just follow my trading rules. They are:
1. At least one of the following criterias must apply.
A, Chart is in a blow off top
B, Chart is in a test of resistance
C, A very strong fundamental case for entry exists
2. Manage bet size. A 3X leveraged chart must be able to withstand 700% from bottom to top.
3. When exiting shorts do not re-enter them when the chart goes back up. See point 1.
4. Tests of resistance should be bet very carefully from low positions.
5. Limit the total number of trades. Really good setups do not come that often.
Can you believe it. I did not follow my own rules. Initially I identified a test of resistance (trading criteria 1 A) but I went in way too heavy early on. I added to positions very soon after the initial position without my trading criterias met for those additional entries. I totally violated rule number 3.
Even though i had rules I did all this. The problem is that trading takes place under long period of time. Dicipline gets lost during the way. I forgot why I had the rules and I even forgot I had them.
I am thankfull for this hard earned lesson.
Tuesday, July 7, 2015
Volatile day for natural resources
Oil fell further so I added to short positions on DSLV. Silver did this:


So I added to positions there as well by going long AGQ. I sold a lot of other small positions to keep liquidity in check.
I think I'm in a good position in both silver and oil now but what could I have done better? Well I was too eager to add short positions when the charts started to climb. The reason is that for a long period of time nothing happened and then when there finally was some action it was hard too keep the patience. I thought I had learned enough about patience but apparently not. The result was that since I was already in for a fair share of the portfolio size it was hard to keep adding when the charts became more extreme. I did add but less then in the beginning. A better approach would of course have been to be in a position to add more in the later stages with the more extreme prices.
Monday, July 6, 2015
I've been waiting for this
It looks like a clear touch of resistance in DWTI. I went short 15% of the portfolio in DWTI today.


Friday, June 5, 2015
Russia
Russia has fallen a lot lately. But looking at the RUSS chart it has a very clear resistance line. Will this line act as a magnet for the price line? Will the price of Russ reach all the way to touch the resistance line? If so then more bad news from Russia is needed because it is still a bit to climb to reach there. Could the charts not only predict the future of where the ETF price will go but also that more bad news involving Russia will come? Could the chart predict what is going to happen in reality? Because that trendline looks like it wants to be touched.


Tuesday, May 19, 2015


Monday, May 11, 2015
Nothings going on
This is a test of patience. There are no real trading opportunities so liquidity is increasing in the portfolio, currently about 60%. Here are some potential candidates if the charts continues a bit:
DGAZ
DWTI
DSLV
TMV
ERY
SRS
GREK
VNM
But right now it's not even close to a trade anywhere.
DGAZ
DWTI
DSLV
TMV
ERY
SRS
GREK
VNM
But right now it's not even close to a trade anywhere.
Friday, April 10, 2015
This has got to stop

Now that is a lie. I make the same mistake much more than that. And still I manage to be profitable. So what is the mistake that has got to stop? Being too early and not following my rules of trading which are to only enter a stock for one of three reasons:
1, The chart is in a blow off top.
2. The chart is in a test of resistance
3. Strong fundamentals
Since I am 95% about technical trading I rarely use #3 but I keep the option open.
So lets look at some recent examples. The following is a little toppy chart of YINN but for sure not a blow off top but the trigger for these mistakes are 1. Being highly liquid and wanting to find trades and 2. Lack of patience.

So three days later it evolves to a pretty good top pattern but now I entered too early and my average is somewhere in the large gap up when it could have been close to the top, if this turns out to be the top. This was an extra bad decision since shorting Bull ETFs requires extra cation.

My shorting of XIV was even worse. Again the trigger is high liquidity and impatience. I'm not sure what I see here except for wishful thinking. There's no point of resistance being reached here and there's no top, only a decent advance since the last low but that should certainly not be enough for an entry.

A few days later it starts to look ok for a small entry.

The only thing I did right was that I kept the initial position size small. If I had shown more patience I would have gotten a better trade on both of these charts. It only took about three days to have better setups materialize. It would have been well worth the wait.
Friday, March 20, 2015
Biotech top approaching
As can be seen on the chart below Biotech is ready to top. It looks like it will start today with a gap up above 185. This is a level where I start to accumulate shorts.

Here's my entire portfolio right now: Short DSLV, EUO, DGAZ, DWTI, Long NGE and YCS.
Sunday, March 8, 2015
A few charts
Inverse Gold ETF is getting in to spiky territory.


And then offcourse so is silver...
Another one is EUO
It is still early but these charts demand close observation and a light accumulation may be started.
Monday, January 12, 2015
New checklist for trading
I'm stating some strict rules for entries that I have to check before taking a position.
1. At least one of the following criterias must apply.
A, Chart is in a blow off top
B, Chart is in a test of resistance
C, A very strong fundamental case for entry exists
2. Manage bet size. A 3X leveraged chart must be able to withstand 700% from bottom to top.
3. When exiting shorts do not re-enter them when the chart goes back up. See point 1.
4. Tests of resistance should be bet very carefully from low positions.
5. Limit the total number of trades. Really good setups do not come that often.
Subscribe to:
Posts (Atom)